
In the Weeds on Probability Distributions and Elite Athletes
- Ryan Floyd
- Dec 4, 2014
- 6 min read
Ryan Floyd
December 04, 2014
I noticed that accomplished athletes’ performance metrics also exhibit wide variations in their frequency distributions.
Like Derek Jeter. Jeter clearly has skill—as anyone can tell by watching him play—and has a very high number of bases per game. On the left, you can see the bases per game over time; but I don’t see any trends indicating whether he was playing well or poorly at any given time. He had a handful of games with poor output: in one game, despite trying his best, he had no bases at all. And yet some games he nailed down 10 bases with all of his hits and walks. What is going on here? Jeter is incredibly talented, but he is competing against the best pitchers in the world. He operated in a field with a wide variation of output despite having tremendous skill. Could he have improved his actual batting ability? Yes. Would he still have faced entire games with no bases? Probably!
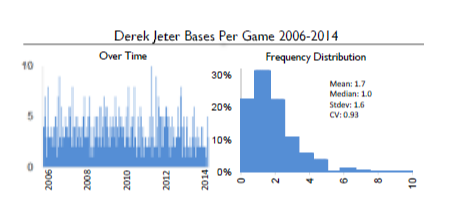
Source: Sports Reference Database
Interestingly, the performances of Tom Brady and Kobe Bryant exhibit a different shape in their frequency distribution, with many more games being clumped around the average game.

In each individual game, talking heads mention the reasons for Brady or Bryant’s particular performance with headlines I grabbed from Google News like: “Tom Brady has been on Fire Since Being Destroyed by the Chiefs,” and “Bryant breaks out of Slump.” I am sure each of them had good and bad games. Both are well known for their grueling work ethics and desire to get better. And yet their performance seems to follow something almost approaching a bell curve.
We can also compare the variability in performance among these players. I can’t make any judgments as to whether anyone is better than another, at least in this exercise. Let me walk you through some of the numbers, though. In the table below, we have on the measure of output on the left: Average points, bases, or yards per game. Below it I’ve entered the average twelve-month total return by year for the actual S&P 500 since 1871. Next to it, we see the standard deviation—a statistical term that means, among other things, the value above and below the mean that occurs 68% of the time. If Kobe Bryant has scored 28 points per game on average with a standard deviation of 10, he has scored 18 to 38 points in 68% of his games. To the right, we notice a figure called the “coefficient of variation,” also known as “CV.” This allows us to compare variation in different fields, by taking the standard deviation divided by the mean. In essence, a player with a lower CV exhibits less variation than one with a lot. Notice how much higher Jeter is than the other players, with a CV of .93 versus .28-.33 in basketball and football. It isn’t really fair, though to judge relative success with the CV across totally different sports. Basketball and Football prove to be sports where the athlete has more control than in baseball, for a variety of reasons, so the variability is less. And look toward the bottom of the graph to see the CV of the S&P 500 real total return since 1871 from Robert Shiller’s database.

So what should we make of this? Different activities follow different shapes of frequency distributions. Some are bell-shaped, and some are pulled to the right or the left. I would venture to say that almost all activities in life and in the world follow some kind of a shape of frequency distributions.
Ryan, are you saying that someone can’t improve their skills because everyone just has bad days?
We can all improve our skills, which is the process. Someone can swing a bat faster, become stronger, and focus better on different keys to a sport. Many authors have discussed this activity in the form of “deliberate practice,” something I can do at Barca by speaking with companies, making models, and reading financial statements. I can also learn about new industries, be more diligent and patient. I can try to learn from times where my analysis was too shallow.
So are you saying that Kobe Bryant and Tom Brady don’t have skill?
On the contrary. Anyone can tell that they are very good at what they do. But I would be wary of judging any trends in their playing. A player may go into a slump or be on fire, but I would suggest that their performance is just fitting in line with a hard-coded variability in their various professions.
Is Bryant better than Jeter because the frequency distribution of his performance is tighter around the average?
No. I think that baseball is just a different kind of game than football. A basketball player has greater control than a batter in baseball, for whatever reason.
I’m trying to make here aren’t about showing who is better or worse: it’s about the limitations of the range and frequency of positive outcomes, even among demonstrably skilled individuals like Bryant and Jeter.
Is this some kind of a comment about determinism versus free will?
Somewhat, yes. I’m not suggesting that a guiding hand moves Kobe Bryant’s ball in or out of the hoop. Yet I notice many processes that look like random noise when seen chronologically, but show very specific shapes of a frequency distribution. This implies that many different activities follow a preprogrammed type of variability. The game for investors and athletes would be trying to increase that average level of performance; recognize that variability and randomness will exist even at some preprogrammed rate; and that one should try to analyze one’s mistakes but keep a skeptical eye towards the lessons learned from differences in output. Maybe the underperformance wasn’t a “mistake,” but just the pendulum naturally, temporarily, swinging in the other direction.
How would you compare this to comments by Nassim Taleb on being Fooled by Randomness?
He writes a lot that people often attribute large causes to things that were only random in nature. I think life, investing, and sports aren’t random, but they fit some underlying frequency distribution. If Tom Brady’s performance were random, we wouldn’t be able to find any pattern in the frequency distribution of his yards per game. It might look like this, the frequency distribution for digits in the number Pi to 10,000 digits, what is called a Uniform Distribution. Instead, it fits pretty closely into a normal distribution, like a bell curve. The challenge for us, living on this earth, is that many of those probability distributions are unknowable when we don’t have any data. If you are curious, keep track of some variable in your own life—commuting time, successes at work, pages read per week—and send me the data. I’d be happy to tell you if it follows some pattern. I found that Google Maps’ time estimate errors fit a lognormal distribution with most estimates fairly correct until a few were extremely wrong.

This sounds academic, but it’s actually a helpful narrative. Playing lacrosse in high school and college, I used to overanalyze each of my games, to a potentially unhealthy degree. I was so excited after I scored six goals and had five assists against Rutgers my freshman year the first day my future in-laws saw me play. And yet I was dispirited when I dropped the ball, missed a few passes and went scoreless against one team my senior year or got the ball taken away from me by the defensemen on that team. I just spent too much time after each game trying to analyze the reasons for this or that mistake. I just couldn’t understand in my heart that we all have good and bad days on the field. Or that these things occur even at some specific rate. I’d like to think now I have come to peace with this desire for over-analysis. We can best learn from relative performance in investing by focusing more on the actual process than the outcome.
Notes on Sports Figures:
In this article, some games of the players in each graph were eliminated where the player was not deemed to fully participate in the game (by reason of illness or otherwise). Note in 2013, Derek Jeter didn’t play a full season. Due to the forgoing, neither of Ryan Floyd or Barca Capital guarantees that the sports figures are accurate. Further, neither of Ryan Floyd nor Barca Capital intends that these graphs or numbers should be interpreted as investment advice or to suggest that investment returns in the future will be like they have been in the past.


Comments